Chart Patterns
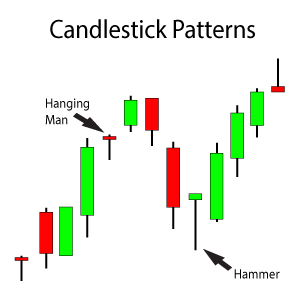
Identifying chart patterns can help an investor or trader to develop expectations for a stock’s share price based. These expectations are based on the historical and statistical results of the chart pattern identified.
There are dozens upon dozens of chart patterns. Each pattern has its own characteristics and tendencies. One chart pattern may represent a “reversal pattern” while another chart pattern may represent a “continuation pattern”. A pattern is a pattern because it is something that develops over and over again. Chart patterns have statistical tendencies and these tendencies can be used to calculate estimated price targets for a stock’s share price.
These statistical tendencies can also provide price target projections based on historical results as a general guide. Therefore, chart patterns help you identify specific price targets that can be monitored using different time frames (short, medium or long-term).
Identifying Chart Patterns
 So how do I start identifying chart patterns on my favorite stock? First, print out your favorite stock chart. Yes, I said print. Like on paper. Then start drawing some trendlines on the chart and follow the guidelines I discuss on my Drawing Trendlines page because a good portion of chart patterns are identified through drawing trendlines.
Trendlines help to identify support and resistance areas. But after you draw several trendlines on a stock chart, that is when you may start to see a pattern, or not. Identifying chart patterns takes a little bit of practice.
As with every other method of technical analysis I use, I like to supplement chart patterns with another form of technical analysis. I prefer Elliott waves.
There are some trading platforms that have pattern identification programs built into them, like Think or Swim from TD Ameritrade does (the trading platform that I use).
These identification programs work OK to an extent, but remember that this is something that has to be pre-programmed with logic to identify. Any minor violations of that logic and the chart pattern identification program may not be able to identify a chart pattern that a trained eye can. Identifying chart patterns consistently will take some practice, but the results will start to pay off handsomely!
Common Chart Patterns
So now that you have a little background on chart patterns, let’s next look at a few illustrations for the most common chart patterns. I discuss these patterns in greater detail in the Trendy Stock Charts members area; I also talk about different trading techniques for each pattern.
Cup With Handle

Cup With Handle Chart Pattern
- the handle should form in the upper half of the pattern
- there should be decreasing volume in the handle
- the handle should not pull back more than 15%
The Cup with Handle chart pattern and Double Bottom chart pattern can sometimes look similar, however the Cup with Handle chart pattern will tend to have a flatter correction at the bottom of the Cup. A Double Bottom pattern is more volatile when forming the bottom of its pattern.
Double Bottom

Double Bottom Chart Pattern
A Double Bottom chart pattern tends to have a spike and then re-test of the bottom area. The typical re-test results in a break slightly below the 1st bottom.
Double Top

Double Top Chart Pattern
Double Top chart patterns are rather easy patterns to identify on a chart. Think of two mountain peaks on the horizon with a valley in between them. Both peaks approximate the same height. That is the basic description of a Double Top chart pattern.
Head & Shoulders

Head & Shoulders Chart Pattern
When the Head & Shoulders chart pattern is seen at the end of a long extended uptrend, be extremely cautious! It could be signaling a major top area for the share price (like the one illustrated) and significant price declines may lie ahead for the stock.
Chart Patterns – Analysis
Of the dozens of chart patterns, the above 3 patterns are probably the most common. Like most things in life, too much information it not necessarily a good thing. Sometimes it can lead to information over-load.
In the Trendy Stock Charts members area, I review chart patterns that tend to have the best success rates (like the above patterns). Other patterns I discuss and review include Double Tops, Flags, Megaphones, Trading Channels, Triangles, Triple Bottoms and Triple Tops.
In my premium stock market updates, I then combine chart pattern analysis with other types of analysis like trendlines, moving averages and Elliott waves. After comparing the results from the different types of analysis, I determine where the support and resistance areas are. I then calculate price targets based on these support and resistance areas.
The more technical analysis methods that confirm the possible movement for a stock, the more comfortable I feel investing in that stock.
Join Trendy Stock Charts
 If you are a Trendy Stock Charts member, you can access the members-only area where chart patterns are just one of the many topics of discussion. Identifying Apple’s Cup with Handle chart pattern paid off nicely for me and my members. What is the current chart pattern developing on Apple’s chart? What about Starbucks? Facebook?
Identifying chart patterns for these companies can help to to identify support and resistance areas. These support and resistance areas can be used as places to buy and sell shares.
Join Trendy Stock Charts today and drop your company’s name and ticker symbol in the Idea Chamber (members-only forum) and request that I analyze your favorite stock chart for chart patterns. I will scour its chart for any developing chart patterns and try to confirm any identified patterns with other methods of technical analysis. And last, I will calculate price targets based on the chart pattern identified.
So what are you waiting for? Click the button below to start the subscription process and become part of the Trendy Stock Charts team today! Learning not only how to identify chart patterns but also how to trade them is a skill that will last a lifetime.