Trading Channel Tool
A trading channel tool can provide investors with both entry and exit points, in both uptrends and downtrends. This makes the trading channel a very versatile charting tool that investors need to be familiar with.
For those that like the thrill of trading rather than just buying and holding a position, consider drawing a trendline that divides the trading channel in half. A Regression Trading Channel serves mostly the same purpose.
Trading channels, when placed properly on a downtrend, can also be used to identify when the downtrend is over.
Components
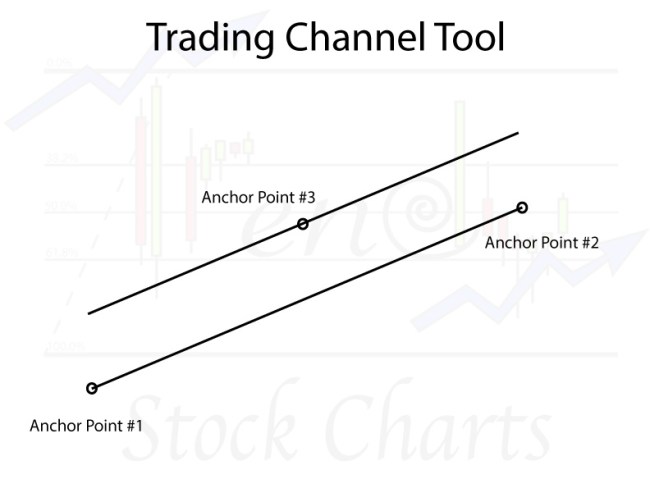
I am going to start with a normal Trading Channel Tool. The various components of a Trading Channel Tool include:
- 3 Anchor Points – Anchor points are used to place the Trading Channel Tool on a stock chart
- Border Lines – The border lines are automatically drawn as the 3 anchor points are being placed on the stock chart
The anchor points and resulting border lines would look something like this:
Just like the other Charting Tools I cover, the Trading Channel Tool can be used on candlestick charts covering different lengths of time such as 5 minute charts, hourly charts, daily charts, weekly and even monthly charts.
However, I find a Trading Channel to be more effective and consistent as a Charting Tool when used on[s2If !current_user_can(access_s2member_level1)]…..
If you want to continue reading about Trading Channels, including proper placement on a chart, trading techniques, tips and warnings, then you must first login.
If you are not a Trendy Stock Charts member, consider joining today! There are several different membership plans available.[/s2If][s2If current_user_can(access_s2member_level1)] weekly and monthly candlestick charts.
Trading Channel Breakout
The a stock’s share price breaks out from a Trading Channel, the next move is usually a very calculated move. Regardless of whether the share price is breaking out or breaking down from the Trading Channel, the next move usually travels the approximate width of the Trading Channel.
Let’s look at this 2 year chart for Sinclair Broadcast Group (SBGI) where I’ve illustrated the above concept. The width of its trading channel is approximately $12. When you add the width of the Trading Channel to the breakout area of $36, a $48 price target is calculated.
The $48 price target calculated by the Trading Channel seems to also be confirmed using a Fibonacci Extension Tool. The 161.8% Target Line, or the current uptrend’s Golden Ratio of $47.49, is just shy of the $48 Trading Channel price target.
When I can reach a price target using multiple methods of technical analysis, it gives me greater confidence that just using a single tool or method.
Chart Placement
Under the Tips & Warnings section below, I discuss a very powerful downtrend test using a Trading Channel. I refer to the test as the “Downtrend Channel Test”.

Tips & Warnings
- Anchor Point #1 from the Trading Channel is placed at the very top of the downtrend.
- Next, place Anchor Point #2 from the Trading Channel at the very bottom of the downtrend. Or at least, what you think is the bottom of the downtrend so far.
- Last, place Anchor Point #3 at the right side of the very widest part of the downtrend.
Placing Trading Channels on numerous older charts and then seeing how a stock’s share price interacted with the Tool’s Border Lines has not only provided me with tremendous insight, but it has helped me to fine tune the placement of the Tool. Channeling a stock’s price history is not as easy as it sounds. Draw the Channel too tight and there will be all kinds of “border breaks”. Draw the Channel too loose and there will be very few “border touches”.
So in order to become better at placing borders for Trading Channels, consider practicing with old chart history as this will help you to become a better chart technician.
Real Chart Examples
So now that you have an understanding of the components of the Channel Trading Tool, it’s time to use the Tool on an actual stock chart.
This is a 5 year weekly candlestick chart for Sinclair Broadcast Group (SBGI). This chart illustrates that its share price broke out of a 4 year Trading Channel.
I find that when a stock’s share price re-tests its breakout area before making significant advances, the subsequent performance tends to be stronger than without a re-test of the breakout area.
[/s2If]


